The Quest for England's River Health Data
How I spent an Easter weekend downloading 25 years of water quality data one API call at a time — because the government deleted the download button.
April 15, 2026
If you've ever tried to answer a simple question with open government data, you'll know the journey is rarely simple. My question was straightforward: which rivers in England are in the worst health, and what's causing it?
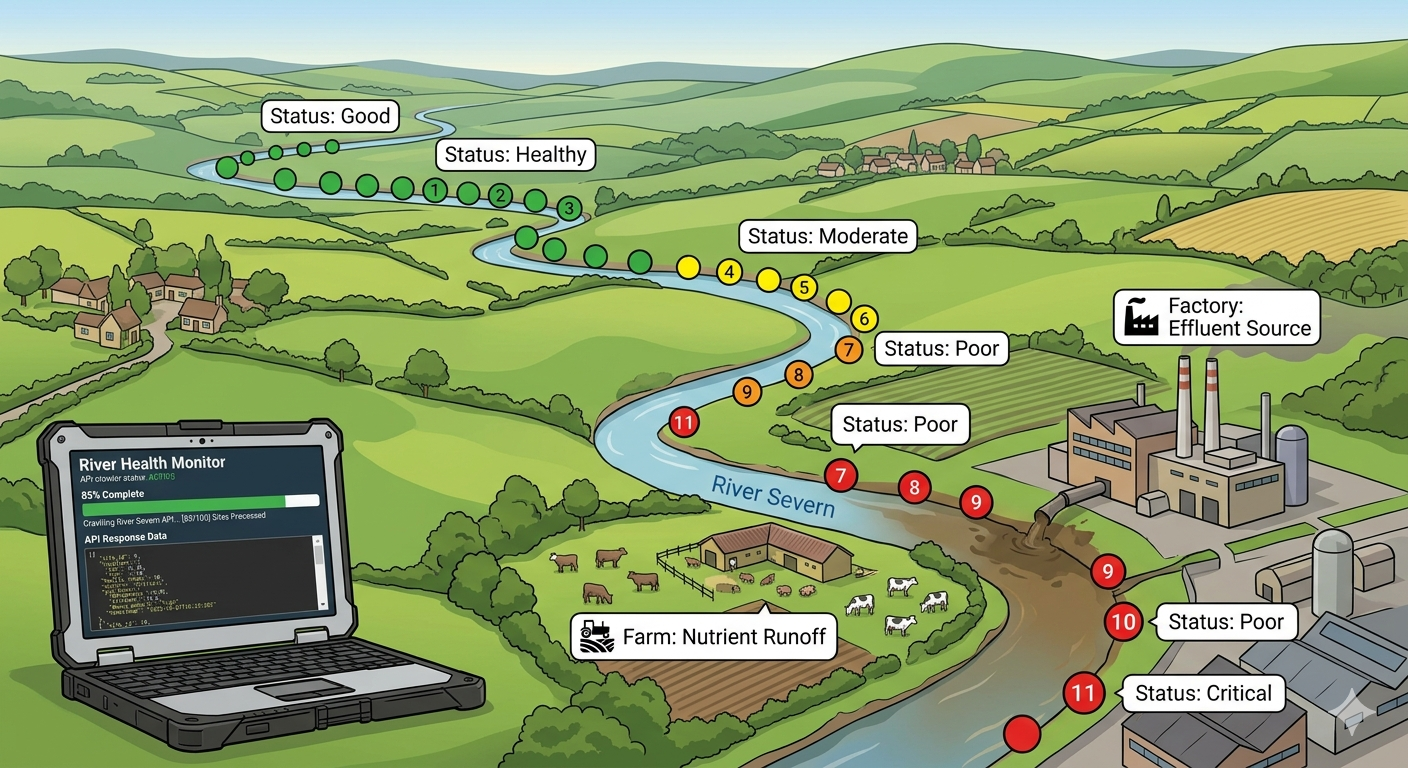
I'm building RiverWatch, an open source web app that visualises Environment Agency monitoring data — water quality surveys, fish populations, invertebrate counts — to help the public understand what's happening to England's rivers. The app already plots 65,000 sampling points on a map and lets you click through to time series graphs. But those are just individual dots. I wanted to connect them into a bigger picture: river-level health scores, colour-coded stretches, filterable by status, with the finger pointed squarely at what's causing the damage.
To do that, I needed to get my hands on the data. All of it.
The Dataset That Disappeared
The Environment Agency's Water Quality Archive — known to its friends as WIMS — is one of the most valuable environmental datasets in England. It contains over 58 million measurements from 58,000 sampling points, dating back to the year 2000. Phosphate levels, ammonia concentrations, dissolved oxygen, pH, the works. It's the chemical biography of every monitored river, stream, and watercourse in the country.
Until December 2025, you could download the whole thing as a bulk CSV. The kind of download that makes a data engineer's heart sing.
Then, in December 2025, the EA retired the legacy Water Quality Archive and replaced it with a shiny new API built on "FAIR and Linked Data principles." The new system is genuinely impressive from a standards perspective — everything is semantically structured using the SOSA ontology, properly linked, machine-readable. There's just one small problem.
They removed the bulk download.
The new API is paginated, capped at 250 results per request, and limited to 100 sampling points per query. If you want the full dataset, the EA's official position is that users should select only the data they truly need, rather than sifting through entire datasets.
I needed the entire dataset. I did not feel empowered.
The Email
The EA does offer a data request form for specific datasets, so I filled it in. Politely. Specifically. I listed the exact determinand codes I needed, the date range, the format I wanted, even offered to take it split by year. I mentioned the project was open source and non-commercial. I was the model data requester.
The response came back promptly, to be fair. It said no. The bulk download no longer exists and the API is the only route. It was Easter weekend.
The Plan
Right. If the mountain won't come to Muhammad, Muhammad will write a Python script.
The approach was simple in concept, if somewhat exhausting in execution. I already had the list of all 65,190 sampling point IDs — they're bundled into the RiverWatch app as GeoJSON tiles. For each point, I'd query the EA API for all historical observations, filter to the key determinands that drive river health classification, and save the results as a CSV. One file per sampling point.
The key determinands — the ones that tell you whether a river is healthy or dying — are the same ones the EA uses for Water Framework Directive classification:
- Orthophosphate (0180) — the biggest single driver of river failure in England. High levels cause algal blooms that choke everything else.
- Ammoniacal Nitrogen (0111) — toxic to aquatic life at elevated levels. Spikes indicate slurry or manure entering the watercourse.
- Dissolved Oxygen (9901) — the measure of whether a river can sustain life. Low oxygen = dead or dying ecosystem.
- BOD (0085) — Biochemical Oxygen Demand. High BOD means organic matter is consuming oxygen. Classic indicator of sewage pollution.
- Nitrate (0117) — fertiliser runoff signature. Also contributes to eutrophication.
- pH (0061) — too acidic or too alkaline and the biology collapses.
Plus a handful of supporting indicators: suspended solids, conductivity, total oxidised nitrogen, and temperature.
The maths was daunting. 65,000 points × multiple pages per point × 250 results per page = a very large number of API calls. My initial estimate was 10–15 hours.
The Reality
The first version of the script was sequential. One point at a time. Polite. Respectful. Painfully slow.
After 14 hours of running — including an unplanned pause overnight when my MacBook decided it had better things to do than stay awake — I had 2,011 points downloaded. Out of 65,000. At that rate, I was looking at roughly three weeks of continuous running.
I briefly considered whether three weeks was acceptable. It was not.
The Concurrency Fix
The obvious solution was to download multiple points in parallel. Python's ThreadPoolExecutor made this straightforward — spin up multiple workers, each fetching a different sampling point simultaneously. The script was already designed to be resumable (if a CSV file exists, skip that point), so I could kill it, modify it, and restart without losing progress.
I started with 5 workers. Then 10. Then 20. The EA API, to its credit, handled the load without complaint. No rate limiting. No angry 429 responses. Just steady, reliable data delivery.
At 20 workers, the rate climbed to about 850 points per hour. Better, but still 70+ hours for the full dataset. The bottleneck wasn't my end — it was simply how long each API response took to come back.
I pushed to 40 workers. The rate jumped. Then I went full send and the thing just... ran. Over Easter weekend, while normal people were eating chocolate eggs, my MacBook Pro sat in the corner with a YouTube video playing on screen (the sophisticated anti-sleep mechanism I deployed before discovering caffeinate -s), methodically downloading 25 years of English river chemistry.
The Slash Incident
Midway through, the script started throwing errors. Some sampling point IDs contain forward slashes — SW-GWW16/05, for example. When the script tried to save SW-GWW16/05.csv, the operating system interpreted SW-GWW16 as a directory name and threw a fit. A quick sanitisation fix (replace / with _ in filenames) sorted it out.
The SOSA Surprise
The first version of the parser extracted zero observations from every single point. Zero. Kept. The verbose logging showed hundreds of items coming back from the API, but nothing passing the filter.
Turns out the EA's new API uses an entirely different data structure from the old one. What used to be determinand.notation is now observedProperty.notation. What used to be result is now hasSimpleResult or hasResult.numericValue. The old flat JSON had become a richly structured linked data graph using the SOSA (Sensor, Observation, Sample, and Actuator) ontology.
Semantic web enthusiasts would call this progress. I called it an evening of debugging.
What Emerged from the Data
After the crawl finally completed, I ran the processing pipeline. Of the 65,190 sampling points:
- 5,462 had usable river health data (the key determinands we were looking for)
- 59,728 were empty — sewage treatment works, trade effluent monitoring, groundwater wells, and industrial compliance points
The 5,462 points with data were scored using the Water Framework Directive's classification methodology. The WFD uses a "one-out-all-out" rule: a point's overall status is determined by its worst-performing determinand. If phosphate is Bad but everything else is High, the overall status is Bad. This is how the EA itself classifies waterbodies, mandated by EU legislation that the UK retained post-Brexit.
The results were stark:
| Status | Points | Percentage |
|---|---|---|
| High | 1,311 | 24% |
| Good | 766 | 14% |
| Moderate | 452 | 8% |
| Poor | 613 | 11% |
| Bad | 2,115 | 39% |
| Unknown | 205 | 4% |
Nearly 40% of monitored river points in England scored Bad. Only 38% achieved Good or High status.
This broadly aligns with the EA's own reporting — just 14% of English rivers meet good ecological status — though our numbers aren't directly comparable because the official WFD classification incorporates biological quality elements alongside the chemistry, and uses river-type-specific thresholds that vary by alkalinity and altitude. Our scoring uses simplified flat thresholds, which we're transparent about.
But the story the data tells is unmistakable. England's rivers are in trouble.
What's Next
The scored data is now live on RiverWatch. You can see colour-coded sampling points across the map, filter to show only Poor and Bad sites, click through to determinand breakdowns showing exactly what's failing, and view time series graphs that load instantly from pre-processed static files rather than waiting for the EA API.
The next step is linking these point-level scores to actual river stretches. The EA divides each river into Water Framework Directive waterbody segments, each a few kilometres long, with their own classification and — crucially — their own "Reasons for Not Achieving Good Status" (RNAG) data. The RNAG dataset is the finger-pointing layer: it literally records whether a stretch is failing because of agriculture, the water industry, urban runoff, or something else.
When that's wired in, you'll be able to look at a stretch of river, see it's in Bad status for phosphate, and see that the EA attributes it to agricultural diffuse pollution. Or see a stretch failing for ammonia near a sewage treatment works, attributed to the water industry. The data exists. It just needs connecting.
The Bigger Picture
The whole experience crystallised something I'd been thinking about for a while. Open data is only open if people can actually get to it. The EA's water quality data is technically available — it's published under the Open Government Licence, the API is documented, anyone can query it. But the practical barrier to accessing it at scale is now enormous. A paginated API with a 250-result limit and no bulk export is, for all practical purposes, a locked door with the key hidden under a very heavy rock.
The irony is that the EA's own analysis depends on bulk access to this data. Their scientists, their Catchment Data Explorer, their WFD classifications — all of it requires the kind of comprehensive dataset view that the new API makes impractical for external users. The asymmetry matters, because public accountability depends on the public being able to see what the regulators see.
I don't think this is malicious. The new API is genuinely well-designed from a technical standards perspective. But somewhere in the modernisation process, the use case of "researcher or civic tech developer who needs the whole dataset" got deprioritised in favour of "casual user who wants to look up their local river." Both are valid. Only one was served.
So here's my request to Defra and the EA: please bring back the bulk download. Or at minimum, offer an annual data dump alongside the API. The data is public. The licence allows reuse. The infrastructure to generate CSVs clearly exists. All that's needed is the will to make it available.
Until then, I'll be here with my 40 concurrent API threads and a caffeinate -s command, doing it the hard way. The rivers are worth it.
RiverWatch is an open source project visualising Environment Agency data to help the public understand river health in England. The code is available on GitHub. All data is sourced from the Environment Agency under the Open Government Licence v3.0.
Health scores shown on RiverWatch are based on simplified WFD physicochemical thresholds and use the same "one-out-all-out" methodology as official WFD classification. They do not account for river-type-specific thresholds or biological quality elements. For official classifications, see the EA Catchment Data Explorer.